
Welcome to our new series of quick, data-driven research briefs, created in partnership with I/O Research. Each brief takes a closer look at what national datasets reveal about the arts sector and what sets the Midwest apart.
This data brief explores the Arts & Cultural Production Satellite Account (ACPSA), a dataset from the U.S. Bureau of Economic Analysis that tracks how money, jobs, and economic value flow through arts and cultural industries each year.
Since the ACPSA covers a lot of ground, we’ve broken our analysis into three parts:
- Part 1: How Big Is the Midwest’s Creative Economy?
- Part 2: (You are here!) What Are Midwest Creatives Earning?
- Part 3: Where Can the Midwest’s Creative Economy Grow?
For a refresher on how the Arts & Cultural Production Satellite Account (ACPSA) works—and what it does and doesn’t measure—check out the intro to Part 1.
Explore the Data Set on Arts Analytics
Play with ACPSA findings on I/O’s new platform that lets users experience the art of data.
Learn More Explore the MapMidwest Arts Workers Earn Less Overall, but Not Per Job
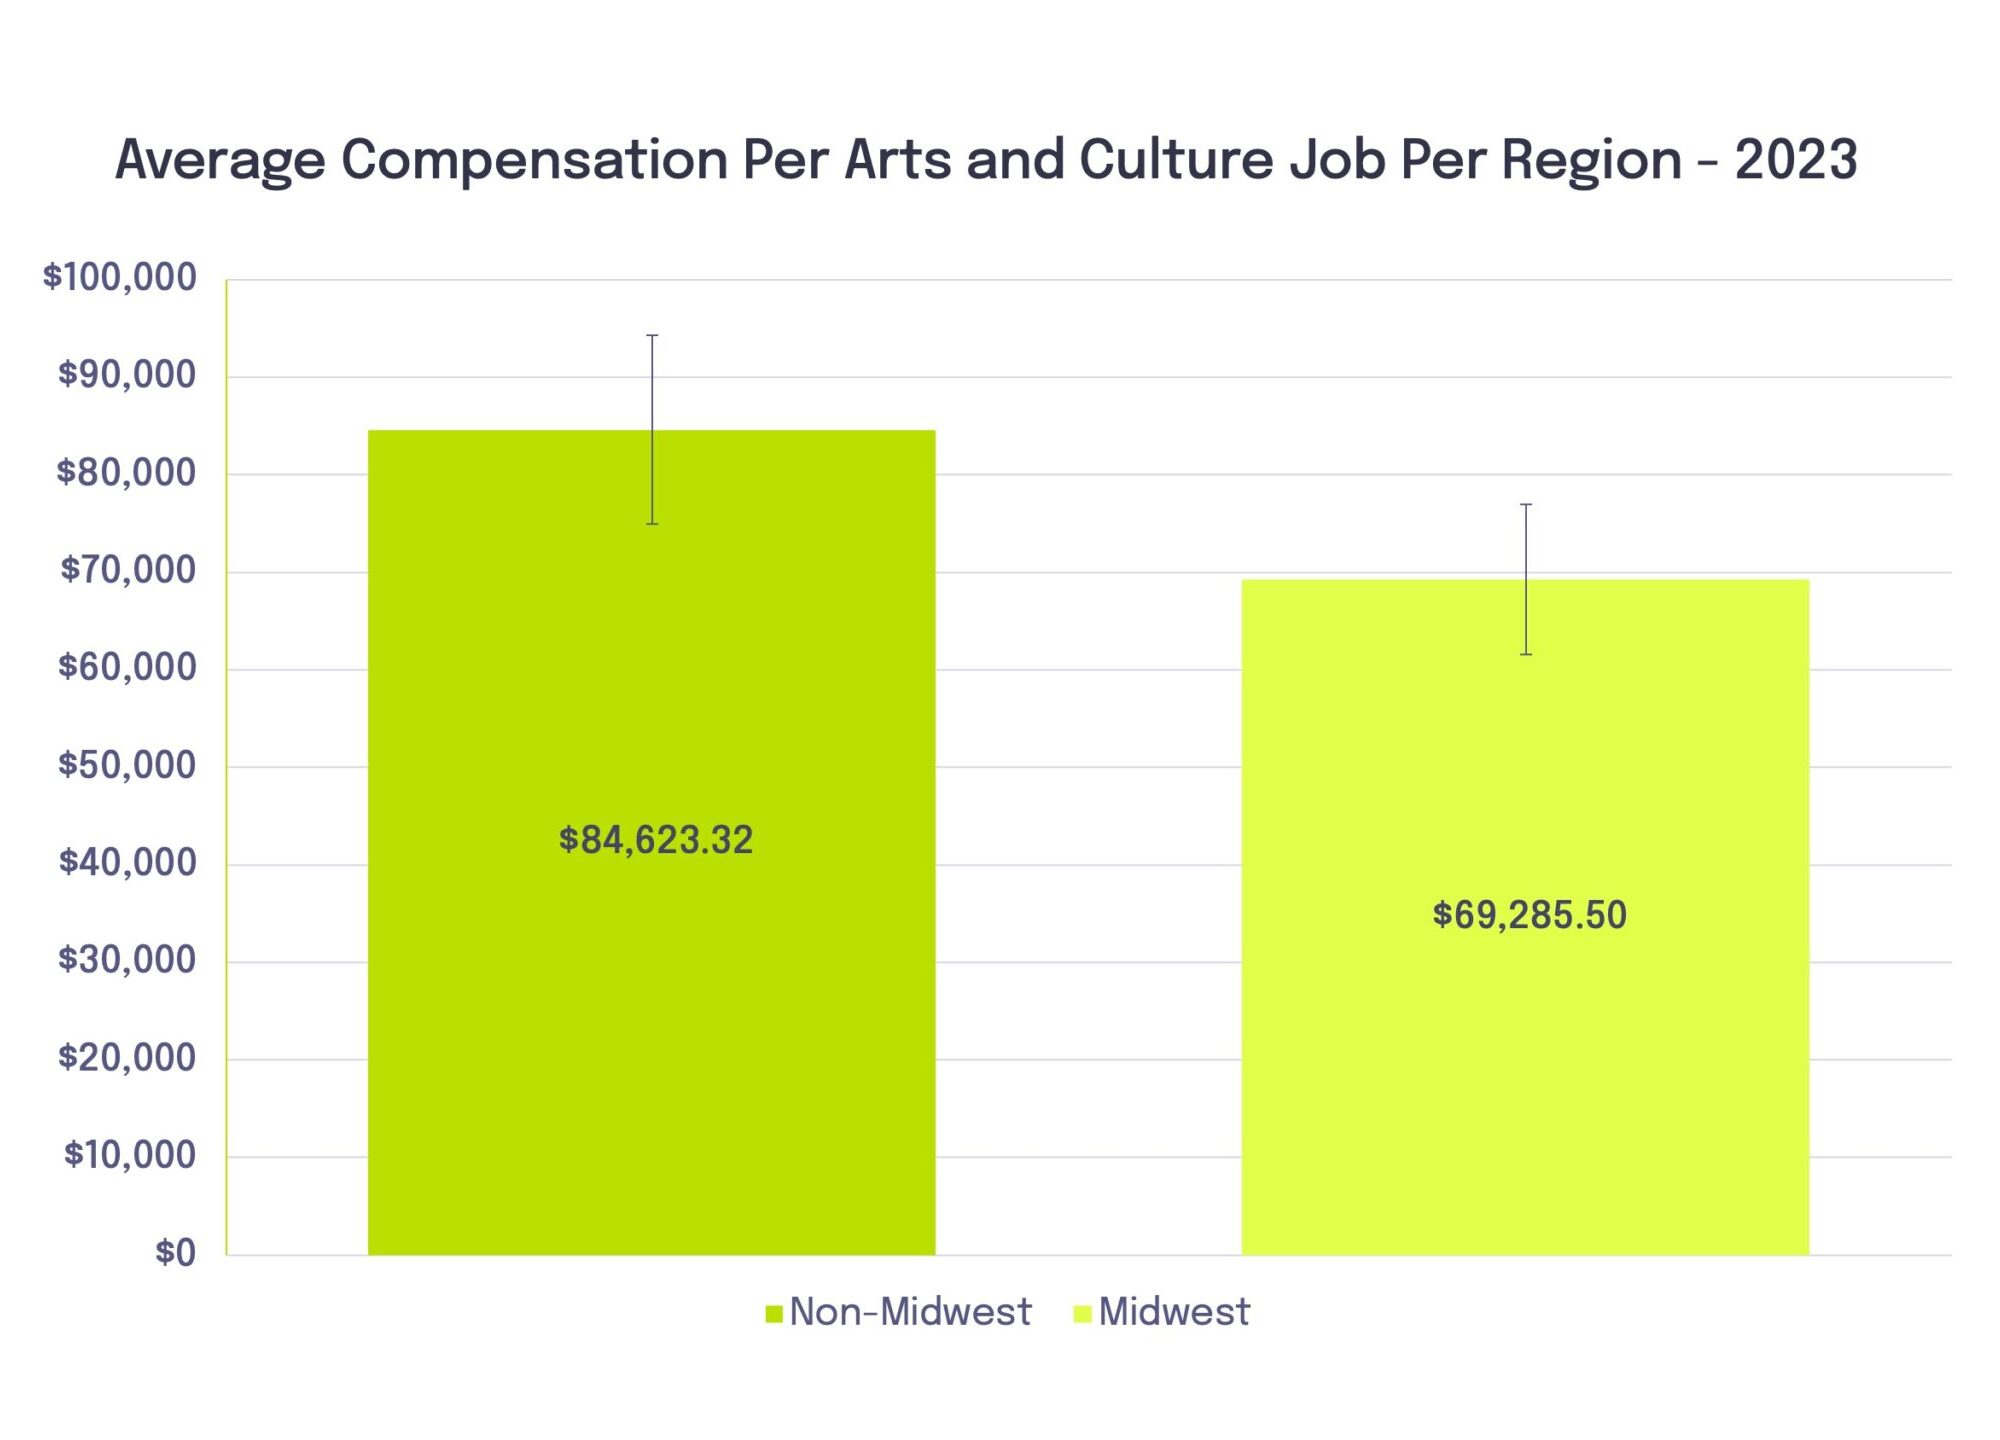
In 2023, Midwest arts and cultural compensation (wages + benefits) averaged $7.4 billion, compared to $11.6 billion in non-Midwest states. This large gap reflects the region’s smaller overall arts workforce.
But when looking at average compensation per job, the Midwest holds its own. Visualized in the figure below, there’s only a slight difference between Midwest and non-Midwest pay, and the confidence intervals overlap, meaning the difference isn’t statistically significant.
TL;DR: There are fewer jobs in the Midwest, but arts workers are paid similarly on a per-job basis.
State-by-State Earning Disparities are Significant
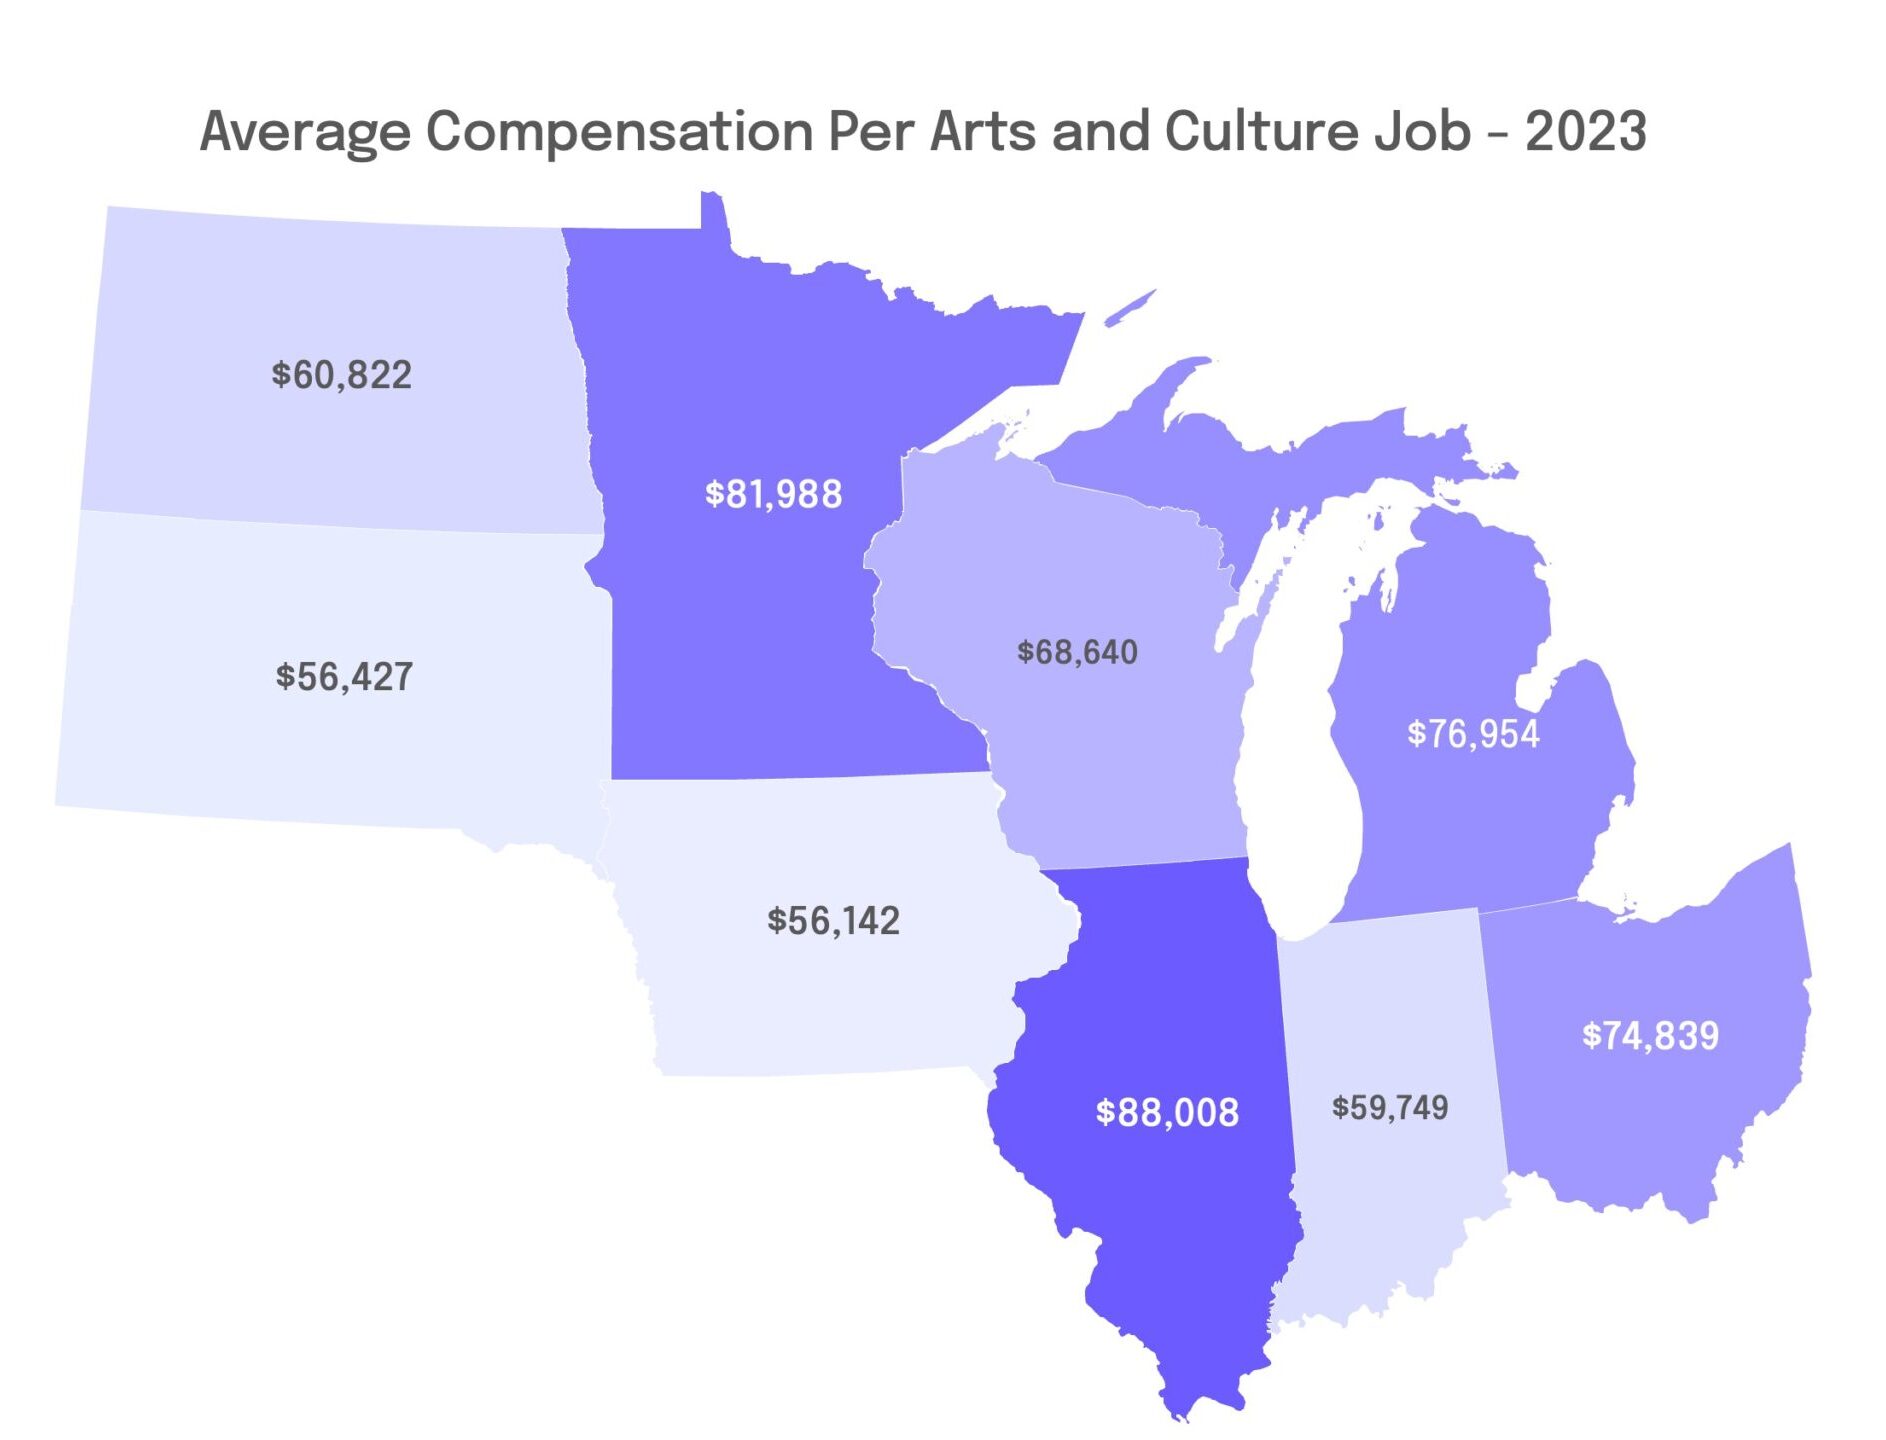
Average compensation in the arts sector varies widely across the Midwest:
- Highest: Illinois ($88K), Minnesota ($81K)
- Lowest: Iowa and South Dakota (~$56K each), with Indiana just above
These differences often reflect each state’s industry mix. For example, Illinois has more high-paying sectors like advertising and publishing, while Iowa and South Dakota’s jobs may skew toward lower-wage support roles.
Government is a Key Employer in the Midwest
In most Midwestern states, the top-paying arts industries include:
- Government
- Internet/media services
- Publishing
- Broadcasting
- Wholesale/transportation
However, these industries are much larger outside the Midwest. For instance:
- Government arts compensation is $3.0 billion (Midwest) vs. $4.8 billion (non-Midwest)
- Publishing is nearly 4× larger outside the region
- Internet media is nearly 10× larger
These disparities reflect the concentration of media and tech on the coasts, but they also highlight the stabilizing role of government in the Midwest’s creative economy.
In a region where other high-paying sectors are less developed, public funding helps anchor the arts ecosystem by providing consistent employment, supporting institutions, and enabling a ripple effect that benefits artists, administrators, and audiences alike.
Independent Artists in the Midwest Earn Far Less than Peers Elsewhere
A key metric—value added per worker—shows stark regional differences in the Midwest. The biggest gap is in independent creative work.
As a quick reminder, value added tells us how a sector directly adds to the economy, through things like wages paid to workers and income earned by businesses. It’s different from total sales or revenue. For example, if a theater sells $1 million in tickets but spends $600,000 on outside services (like printing, costumes, or rent), its value added is only $400,000. Value added shows how much economic activity is being generated within the arts sector itself—not just how much money is moving through it.
Outside the Midwest, artists, writers, and performers generate $292,700 in value per worker. In the Midwest, it’s just $169,600.
And collectively, independent creatives earn about 15× more outside the Midwest than within it.
These disparities likely reflect broader differences in industry presence. For instance, the average motion picture payroll in a Midwestern state is just $226 million, compared to $3.6 billion elsewhere.
This disparity highlights a structural challenge: artists in the Midwest often generate less economic value—not because of talent or output, but because of limited access to capital, infrastructure, and visibility.
And it points to a troubling trend: Independent artists often need to leave the region to command competitive earnings.
Wage Comparisons Reveal Other Regional Gaps
To make wages easier to compare across industries, the table below shows the average compensation per type of job. Looking at the data this way reveals several important patterns:
-
Digital content pays best—but the Midwest discount is steep.
Industries focused on digital media consistently offer the highest wages per job in both the Midwest and other regions. However, Midwest workers in these sectors earn significantly less on average than non-Midwest peers—and the pay gap is continuing to grow.
-
Design-and-build specialties are holding strong.
In architecture, design, and construction-related arts fields, average compensation per job in the Midwest is often on par with—or even higher than—other regions. These “design-build” sectors remain areas where Midwest creatives can compete on equal footing when it comes to pay.
-
Craft manufacturing and heritage sectors are small but gaining momentum.
Jobs in traditional arts manufacturing (such as musical instruments or jewelry) and heritage-focused work (like museums and preservation) make up a small share of the workforce. Still, compensation in these areas is rising, particularly in the Midwest.
-
Live-event promoters are narrowing the gap.
Promoters of live arts events are seeing rising wages in the Midwest, closing what were once sizable regional differences. That said, the Midwest continues to be a lower-paying market for performers themselves.
-
Visitor-facing cultural jobs remain low-wage.
Roles in retail, tourism, and other front-line cultural work tend to have the lowest compensation per job—and the Midwest is falling even further behind in these categories.
Wage Comparison Data Midwest vs. Non-Midwest
| Industry | Midwest | Non-Midwest |
|---|---|---|
| Government | $59,841 | $71,109 |
| Other information services | $155,928 | $275,219 |
| Publishing | $143,207 | $212,596 |
| Broadcasting | $97,003 | $147,636 |
| Wholesale and transportation industries | $103,626 | $110,350 |
| Retail industries | $41,494 | $55,883 |
| Advertising | $102,026 | $123,934 |
| Architectural services | $110,610 | $116,609 |
| Construction | $92,929 | $89,747 |
| All other industries | $84,143 | $92,303 |
| Industrial design services | $110,476 | $95,164 |
| Motion pictures | $44,206 | $107,154 |
| Museums | $44,443 | $51,454 |
| Promoters of performing arts & similar events | $127,521 | $176,327 |
| Printed goods manufacturing | $74,008 | $71,215 |
| Graphic design services | $76,579 | $91,382 |
| Performing arts companies | $71,743 | $117,695 |
| Education services | $49,014 | $64,318 |
| Custom architectural woodwork and metalwork manufacturing | $87,003 | $87,185 |
| Fine arts education | $72,379 | $82,537 |
| Other goods manufacturing | $84,649 | $88,662 |
| Interior design services | $102,053 | $116,052 |
| Independent artists, writers, and performers | $47,905 | $144,842 |
| Computer systems design | $136,515 | $173,827 |
| All other design services | $146,580 | $121,367 |
| Landscape architectural services | $112,321 | $128,857 |
| Rental and leasing | $82,623 | $85,354 |
| Photography and photofinishing services | $51,213 | $63,399 |
| Unions | $39,407 | $48,706 |
| Sound recording | $110,044 | $173,233 |
| Jewelry and silverware manufacturing | $93,960 | $113,311 |
| Musical instruments manufacturing | $105,435 | $132,308 |
| Grantmaking and giving services | $42,555 | $48,881 |
| Agents/managers for artists | $81,940 | $147,247 |
| Other support services | $46,886 | $73,316 |
Conclusion: Closing the Gap
The data shows a mixed picture: arts workers in the Midwest often earn similar wages to those in other regions, but the overall creative economy is smaller, especially in fast-growing fields like digital media, film, and independent work.
Still, the Midwest has real strengths in support industries, manufacturing, and design-related fields, where wages are competitive and growing. These areas offer important opportunities to build on.
Continue reading Part 3, covering opportunities for the Midwest’s arts sector.