
Welcome to our new series of quick, data-driven research briefs, created in partnership with I/O Research. Each brief takes a closer look at what national datasets reveal about the arts sector and what sets the Midwest apart.
This data brief explores the Arts & Cultural Production Satellite Account (ACPSA), a dataset from the U.S. Bureau of Economic Analysis that tracks how money, jobs, and economic value flow through arts and cultural industries each year.
Since the ACPSA covers a lot of ground, we’ve broken our analysis into three parts:
- Part 1: (You are here!) How Big is the Midwest’s Creative Economy?
- Part 2: What Are Midwest Creatives Earning?
- Part 3: Where Can the Midwest’s Creative Economy Grow?
But First: What is the ACPSA?
The ACPSA uses federal economic and labor data to measure how arts and culture contribute to the U.S. economy, including jobs, wages, and industry output. It tracks two types of arts-related industries:
-
1
Core Industries
These industries are at the heart of cultural creation. They include:
- Performing arts like theater, dance, and music
- Visual arts and design
- Film, broadcasting, and publishing
- Architecture and creative writing
-
2
Supporting Industries
These industries make creative work possible by handling production, distribution, and infrastructure. They include:
- Printing services for books, posters, and art catalogs
- Manufacturing of musical instruments, costumes, or set materials
- Broadcasting infrastructure and streaming platforms
- Construction of museums, theaters, and performance spaces
- Transportation and logistics that help move artworks or tour equipment
- Wholesale and retail roles that get creative products into the hands of audiences
In this analysis, we look at core and supporting industries together to understand the full scope of the creative economy.
Notes and Caveats about ACPSA Data
The ACPSA offers a broad view of the arts economy, but it doesn’t capture everything. Here’s a few things to keep in mind before we dig into the 2023 data.
Job totals include employees and some self-employed people who report income through Schedule C tax forms. But many gig workers—especially those paid on 1099s—aren’t fully captured, so the numbers may miss a big part of the creative workforce.
Earnings include wages and benefits for employees, but not income from freelancers, sole proprietors, or small business owners. That means a lot of independent artists and creatives aren’t reflected in these totals.
The ACPSA shows dollar amounts as they were in the year reported—it doesn’t adjust for inflation or cost of living. That means $1 million in 2023 isn’t the same as $1 million in 2013 or in a different state. To compare across time or place, you’d need to adjust for inflation or local costs.
You’ll see this category throughout the ACPSA. It includes things like internet publishing and streaming platforms. Some are clearly arts-related (like music or video streaming), while others are more tech-focused (like data processing or software services). The ACPSA groups them together, so not all activity in this category is cultural.
This tells us how much a sector directly adds to the economy—through things like wages paid to workers and income earned by businesses. It’s different from total sales or revenue. For example, if a theater sells $1 million in tickets but spends $600,000 on outside services (like printing, costumes, or rent), its value added is only $400,000. Value added shows how much economic activity is being generated within the arts sector itself—not just how much money is moving through it.
Explore the Data Set on Arts Analytics
Play with ACPSA findings on I/O’s new platform that lets users experience the art of data.
Learn More Explore the MapThe Midwest Has Fewer Overall Arts Jobs, but Similar Numbers Per Capita
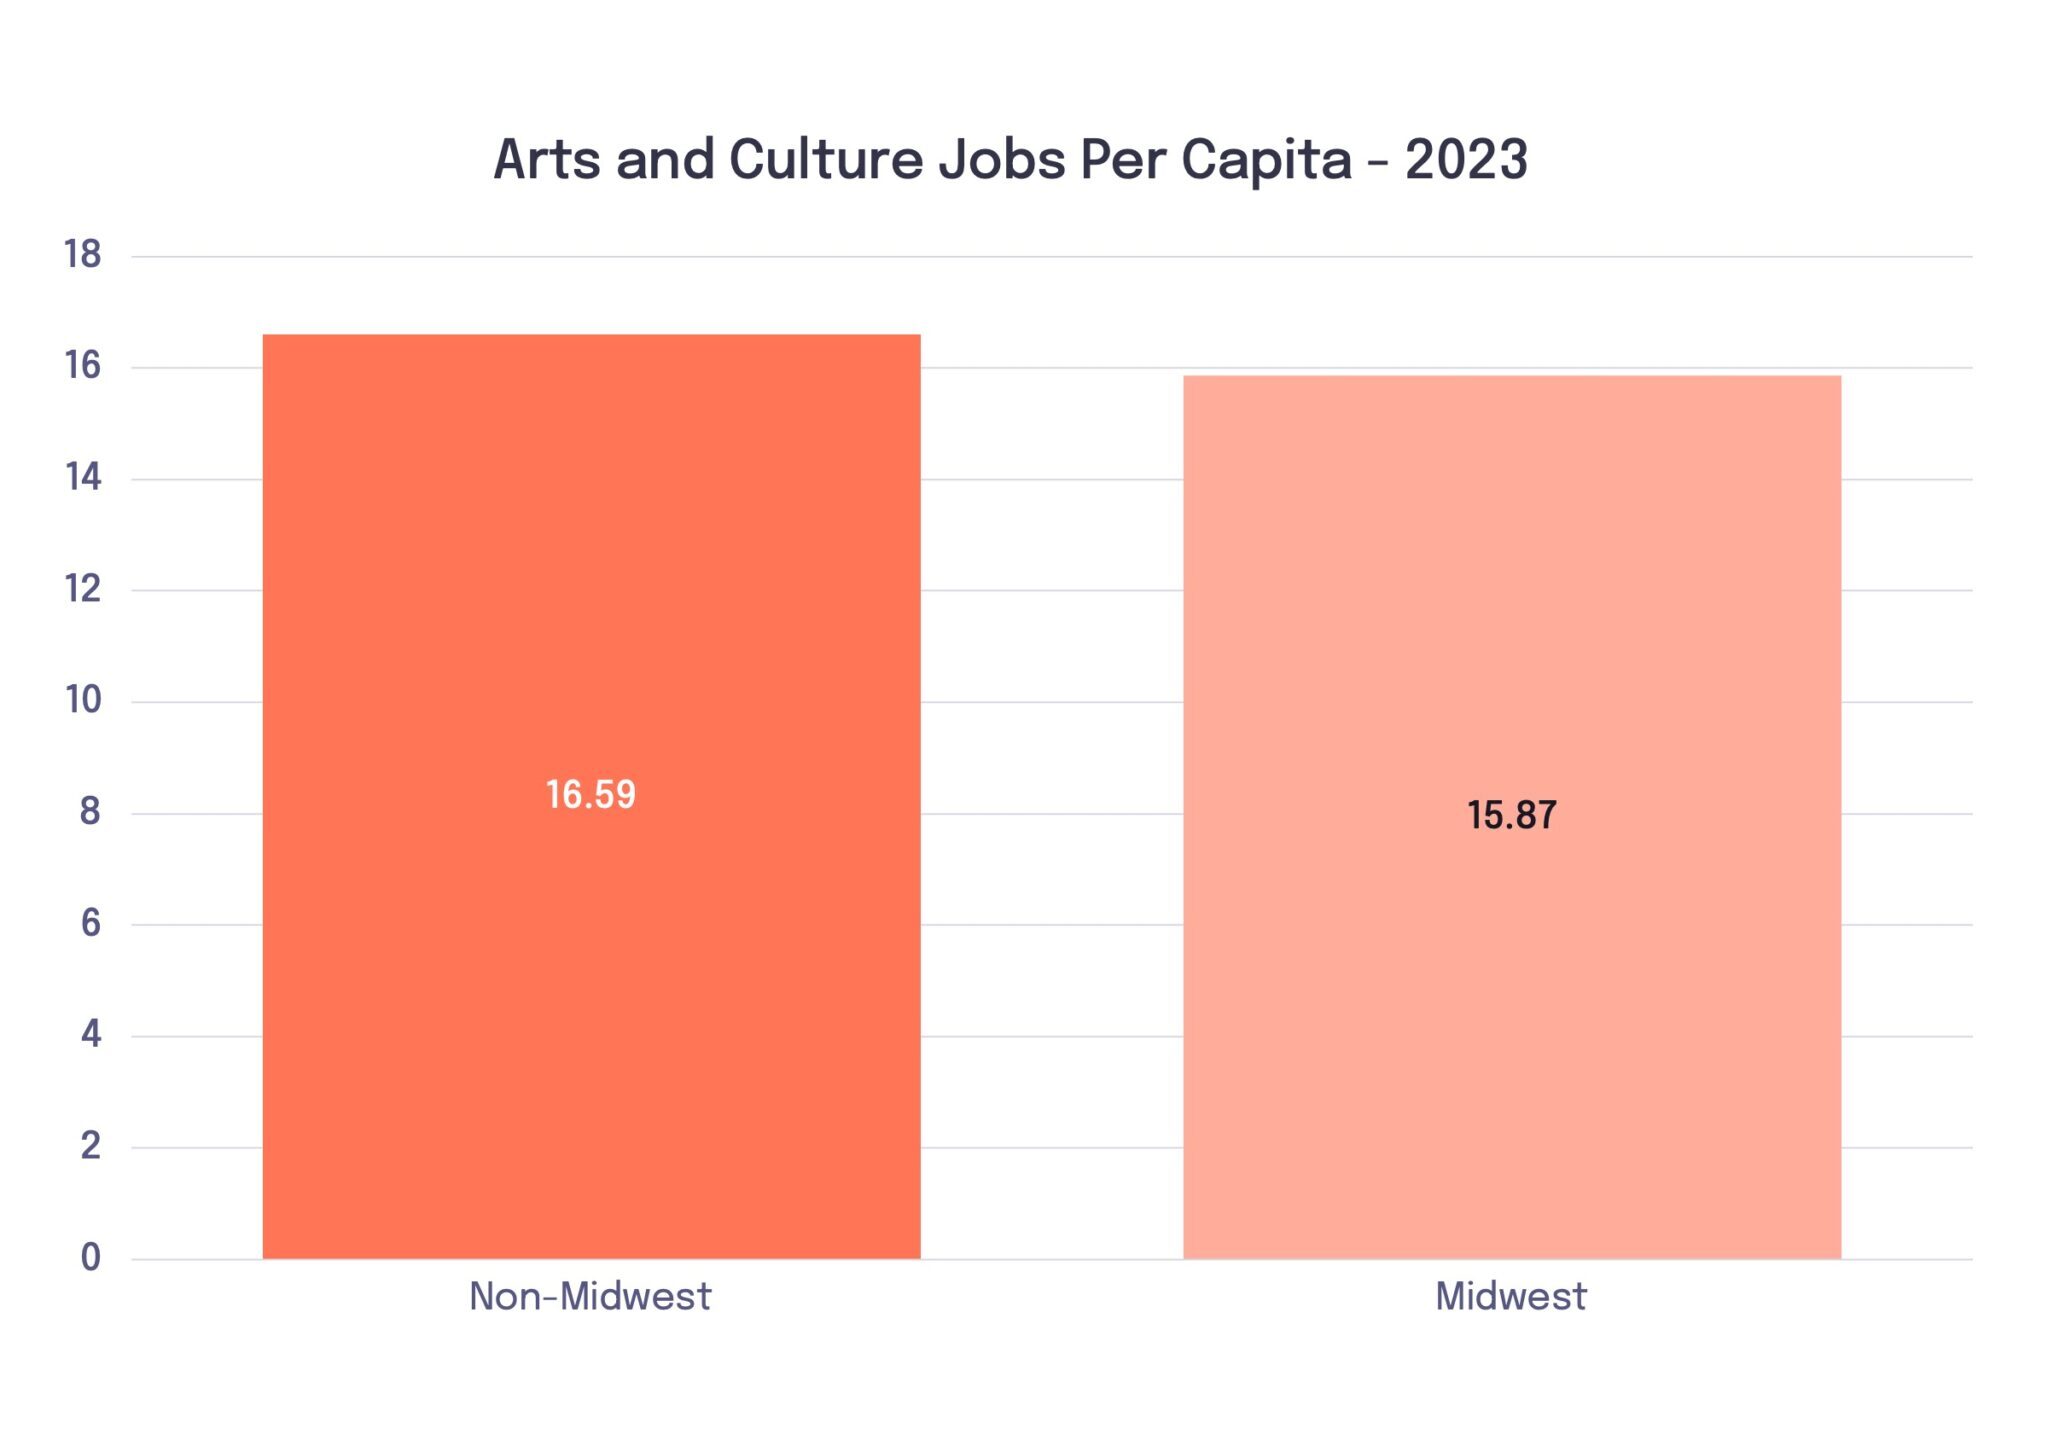
Midwestern states support about half as many arts and cultural jobs as other U.S. regions—about 138,200 per state compared to 276,200 in non-Midwestern states.
But once population is factored in, the gap in arts jobs per capita shrinks considerably, and may not be statistically significant.
In short: while the Midwest has fewer total jobs, it holds its own when adjusted for population size.
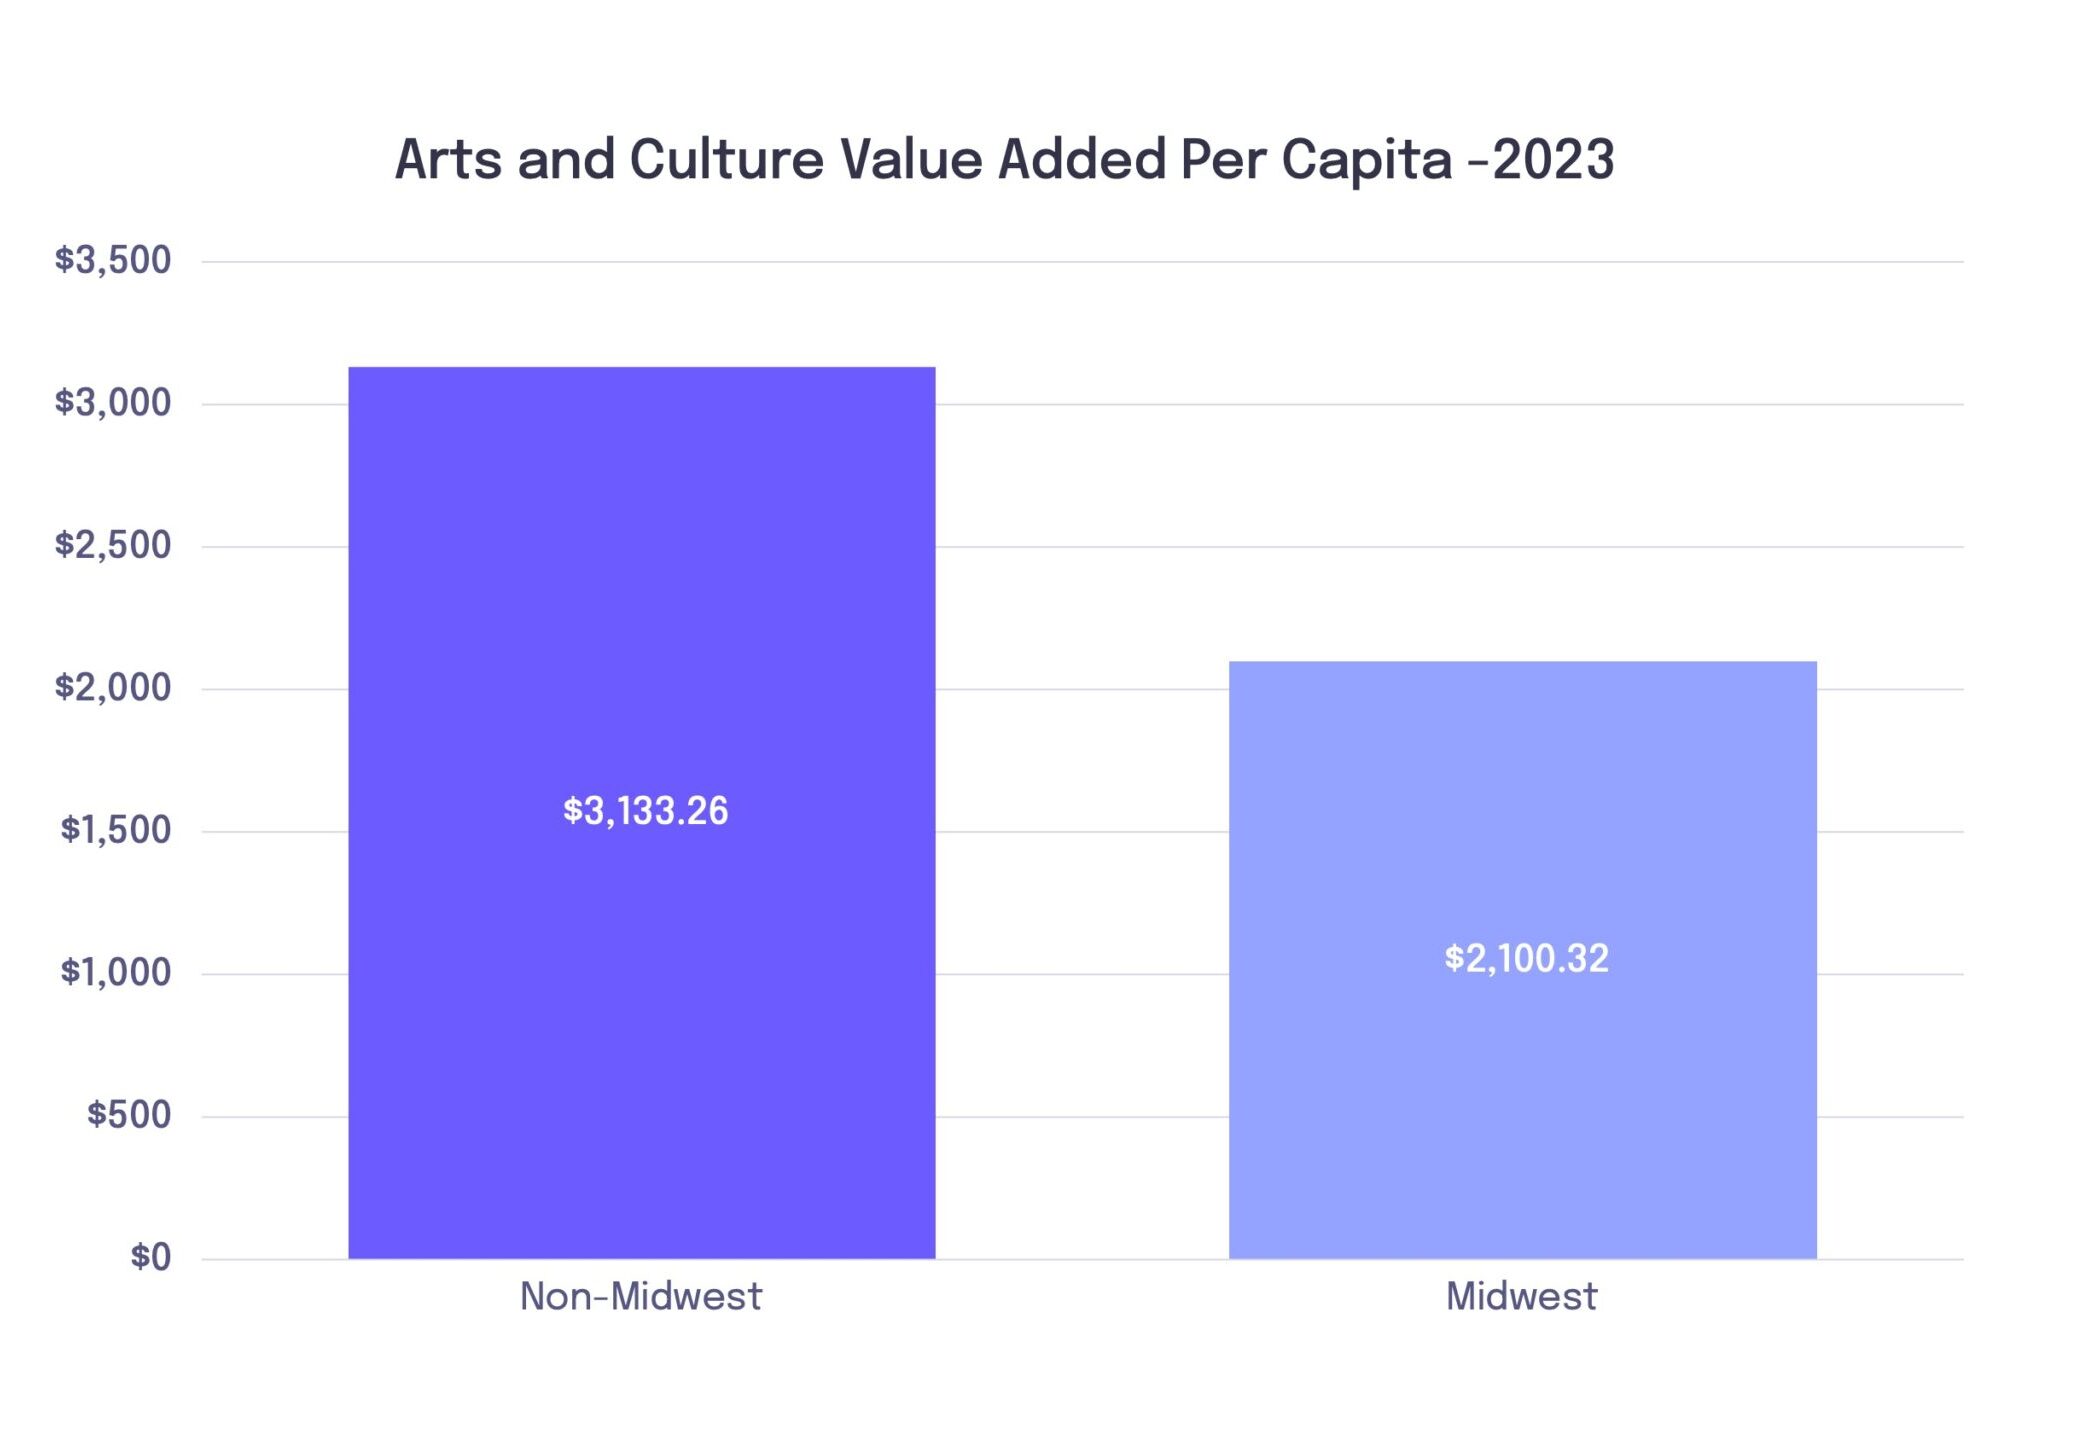
The Midwest has a Lower Economic Output from Arts and Cultural Production
The Midwest trails other regions in total arts and cultural output, measured by how much the sector contributes to state GDP.
In 2023:
- A typical Midwestern state generated $21.3 billion in arts-related value
- A typical non-Midwestern state generated $75.4 billion
Even when adjusted to look on a per-capita basis, the gap remains: $2,247 per Midwesterner vs. $3,753 elsewhere.
That’s a significant gap, and it points to missed opportunities for investment, innovation, and economic growth in the region’s creative sector.
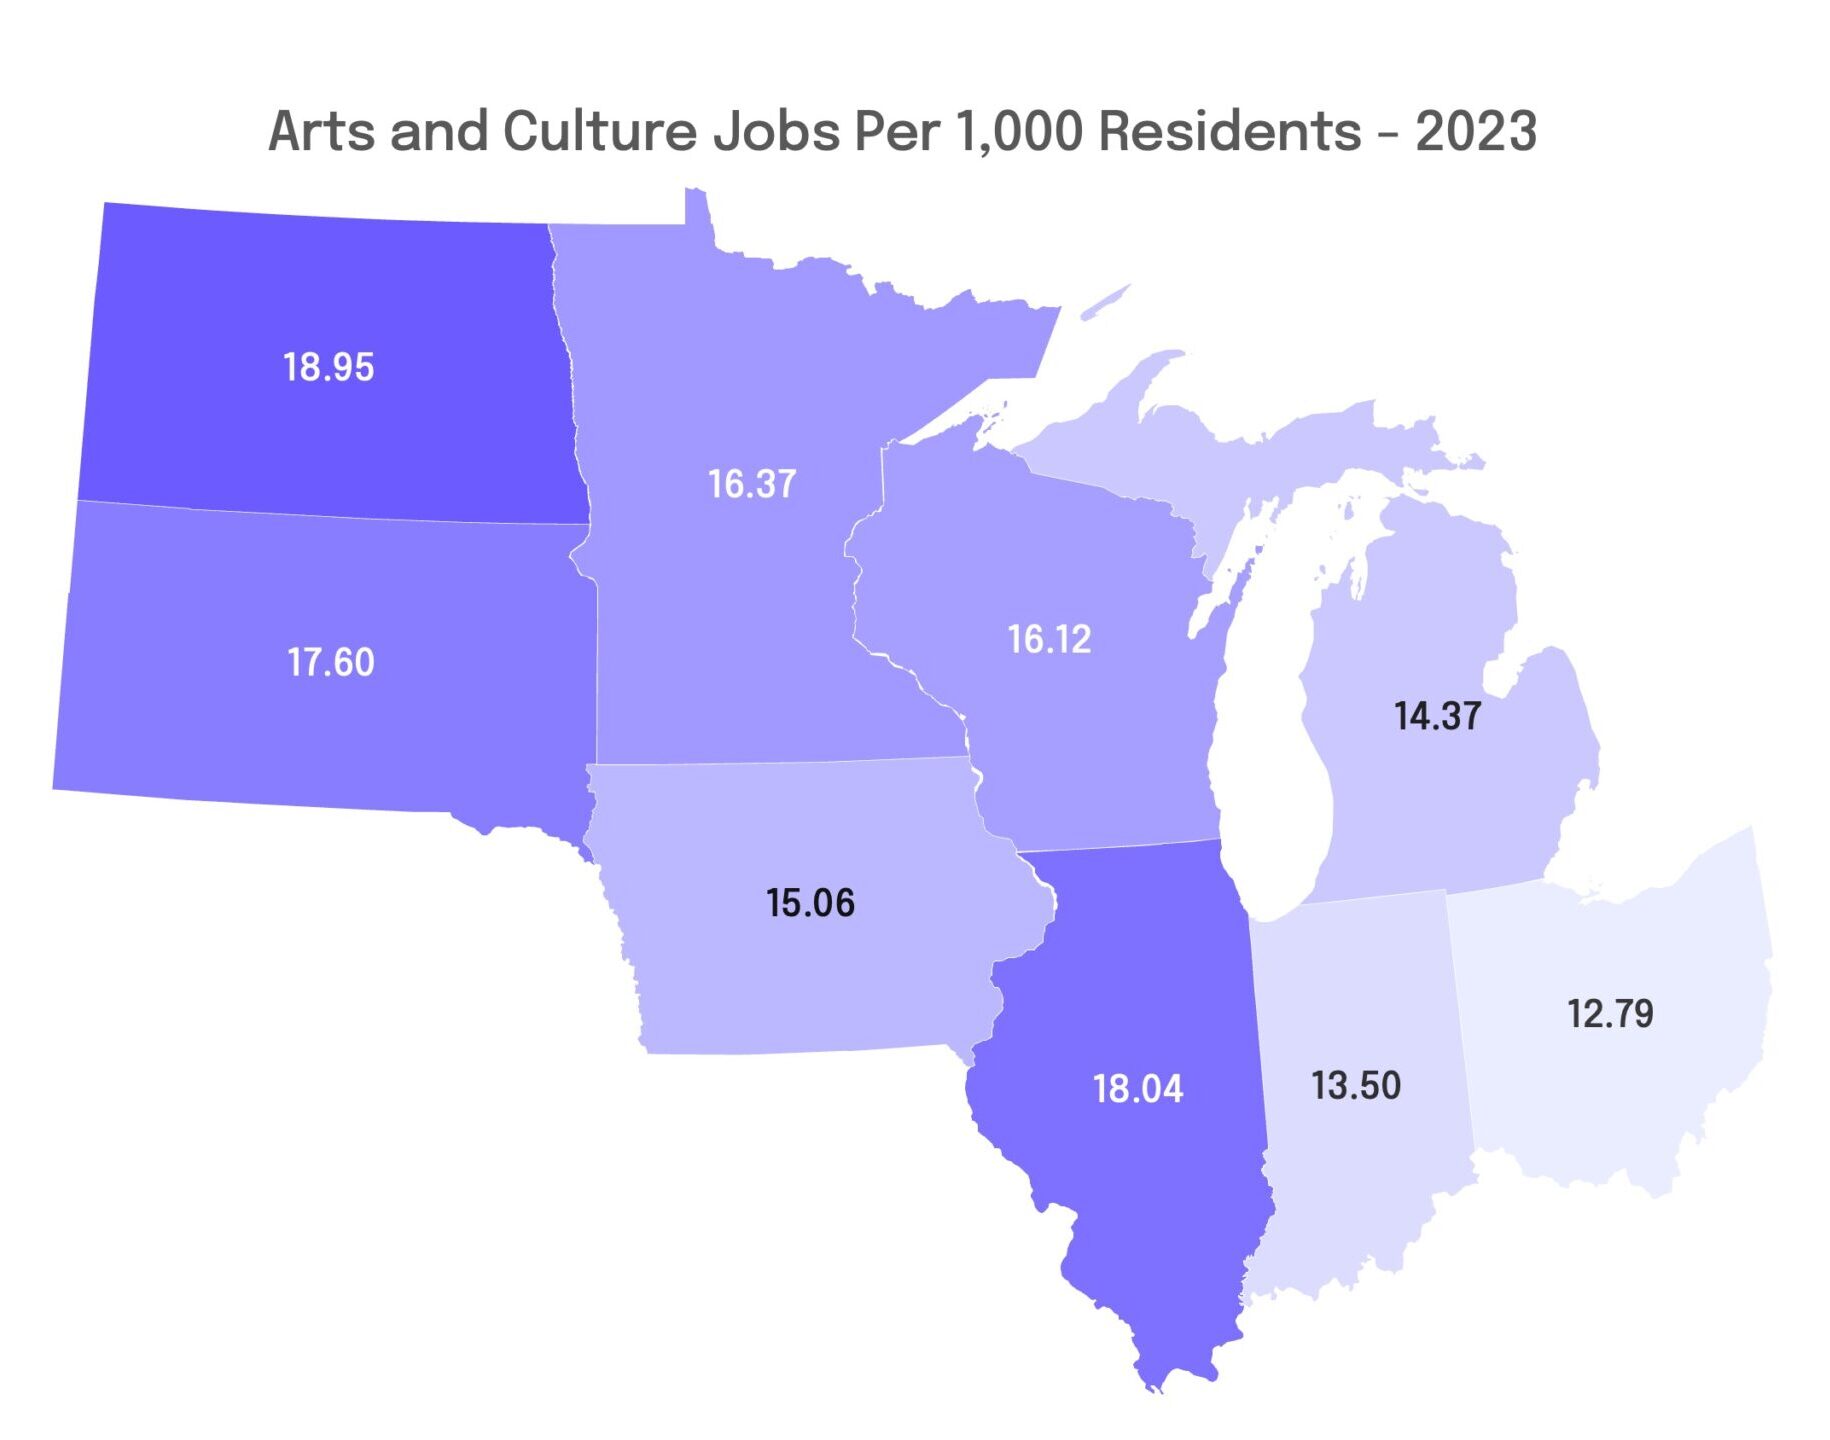
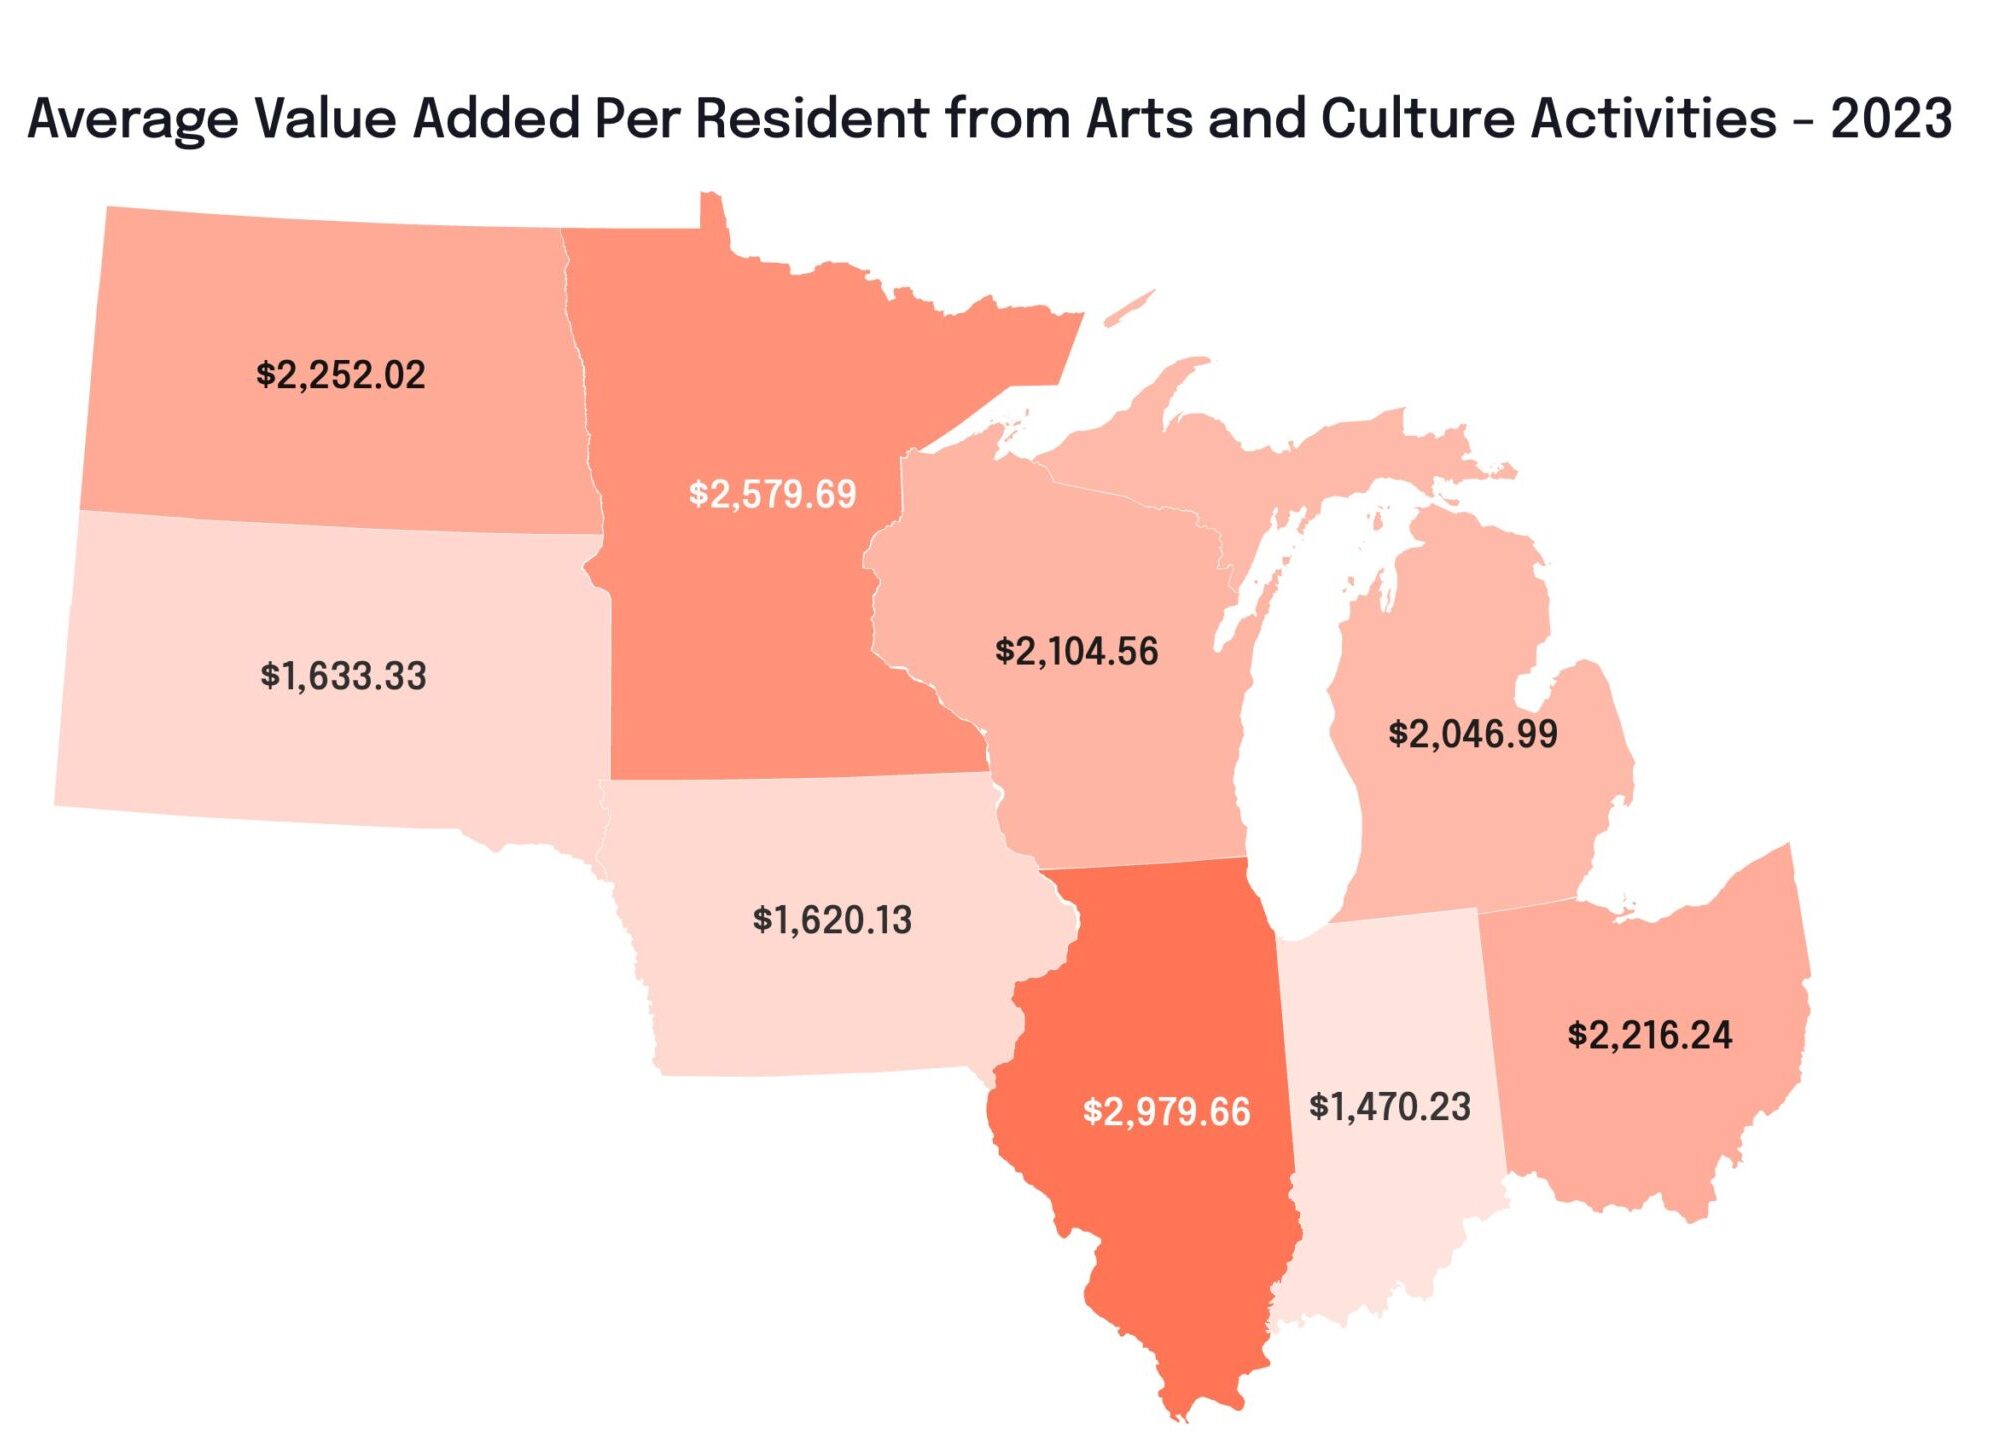
State-by-State Differences in Arts Economic Activity Are Striking
Illinois dominates the region in total arts economic activity, thanks to its population and industry concentration. But on per-capita measures, Minnesota and North Dakota rise to the top.
- Minnesota ranks second in arts GDP per capita, likely driven by robust arts support and infrastructure
- Indiana and Iowa, on the other hand, lag behind—highlighting opportunities for growth and investment
Taken together, these state profiles show that being a large population state is not the only determinant of a strong arts economy.
Design and Manufacturing are Midwest Strengths
Arts employment in the Midwest leans heavily toward design and manufacturing jobs, including:
- Musical instrument manufacturing
- Jewelry and silverware production
- Printing and publishing
- Industrial design services (where the Midwest outpaces other regions)
This reflects the region’s industrial heritage and strong training pipelines, but also creates risks.
The Midwest’s reliance on goods-producing sectors means that changes in manufacturing trends could disproportionately impact the region’s arts employment.
Meanwhile, media and digital content fields are significantly underrepresented, offering a clear growth opportunity.
Employment Patterns Show Gaps and Potential
Looking at arts employment numbers from 2023, several patterns stand out:
- Public sector jobs and government jobs dominate the region’s creative workforce
- Design and manufacturing jobs are more common in the Midwest than elsewhere
- Digital and entertainment jobs (e.g., motion pictures, streaming, publishing) are relatively scarce
- Unionized cultural work is more common in the Midwest than other regions
Remember: The job totals below include employees and some self-employed people who report income through Schedule C tax forms. But many gig workers—especially those paid on 1099s—aren’t captured, so a large portion of artists and creatives aren’t reflected in these totals.
| Industry | Jobs in the Midwest | Jobs Outside the Midwest |
|---|---|---|
| Government | 48,107 | 65,083 |
| Retail industries | 15,470 | 19,271 |
| Broadcasting | 7,019 | 19,945 |
| Wholesale and transportation industries | 6,878 | 13,043 |
| Advertising | 6,209 | 11,066 |
| Publishing | 5,510 | 13,926 |
| Other information services | 5,077 | 23,557 |
| Motion pictures | 4,813 | 28,923 |
| Museums | 4,513 | 7,972 |
| Construction | 3,676 | 7,565 |
| All other industries | 3,654 | 8,138 |
| Architectural services | 3,610 | 8,187 |
| Industrial design services | 2,420 | 1,032 |
| Printed goods manufacturing | 2,300 | 1,942 |
| Education services | 2,012 | 3,723 |
| Graphic design services | 1,949 | 3,631 |
| Performing arts companies | 1,748 | 3,951 |
| Independent artists, writers, and performers | 1,515 | 7,012 |
| Promoters of performing arts and similar events | 1,417 | 2,868 |
| Fine arts education | 1,338 | 2,958 |
| Custom architectural woodwork and metalwork manufacturing | 1,191 | 1,578 |
| Other goods manufacturing | 1,140 | 831 |
| Unions | 831 | 713 |
| Interior design services | 805 | 2,570 |
| Photography and photofinishing services | 733 | 3,051 |
| Computer systems design | 507 | 1,240 |
| Rental and leasing | 490 | 1,262 |
| Landscape architectural services | 486 | 1,406 |
| Grantmaking and giving services | 465 | 945 |
| All other design services | 393 | 703 |
| Jewelry and silverware manufacturing | 273 | 972 |
| Sound recording | 246 | 1,275 |
| Musical instruments manufacturing | 218 | 611 |
| Agents/managers for artists | 180 | 1,666 |
| Other support services | 109 | 576 |
Conclusion: Strengths and Untapped Potential
While the Midwest holds its own in per-capita arts employment and leads in several niche sectors, it still trails in total scale and output—especially in high-growth areas like digital media and independent content creation.
In the next part of this series, we’ll take a closer look at how earnings compare across the region and what that means for the people powering the Midwest’s creative sector.
Continue reading Part 2, covering the earnings of creative workers in the Midwest.